

See your Mac's network connections, traffic, and Wi-Fi details
Whether you want to know which app is online, what is eating your bandwidth, or just your local IP and DNS, the Network page has it.
Network Info
Shows the current interface type, connection state, signal strength, band, and link rate, plus the SSID, local IP, public IP, DNS, gateway, and connection quality. Below are Local Addresses, Hardware Address, DNS Server, Routing Info, Network Quality, and the Interface List. Copy All copies everything as text.
When the public IP goes online
The public IP shows "Not queried" until you click it, and only then does Better Monitor send one request. Apart from AI summaries you ask for, this is the app's only outbound request. Reading the Wi-Fi name requires Location Services.
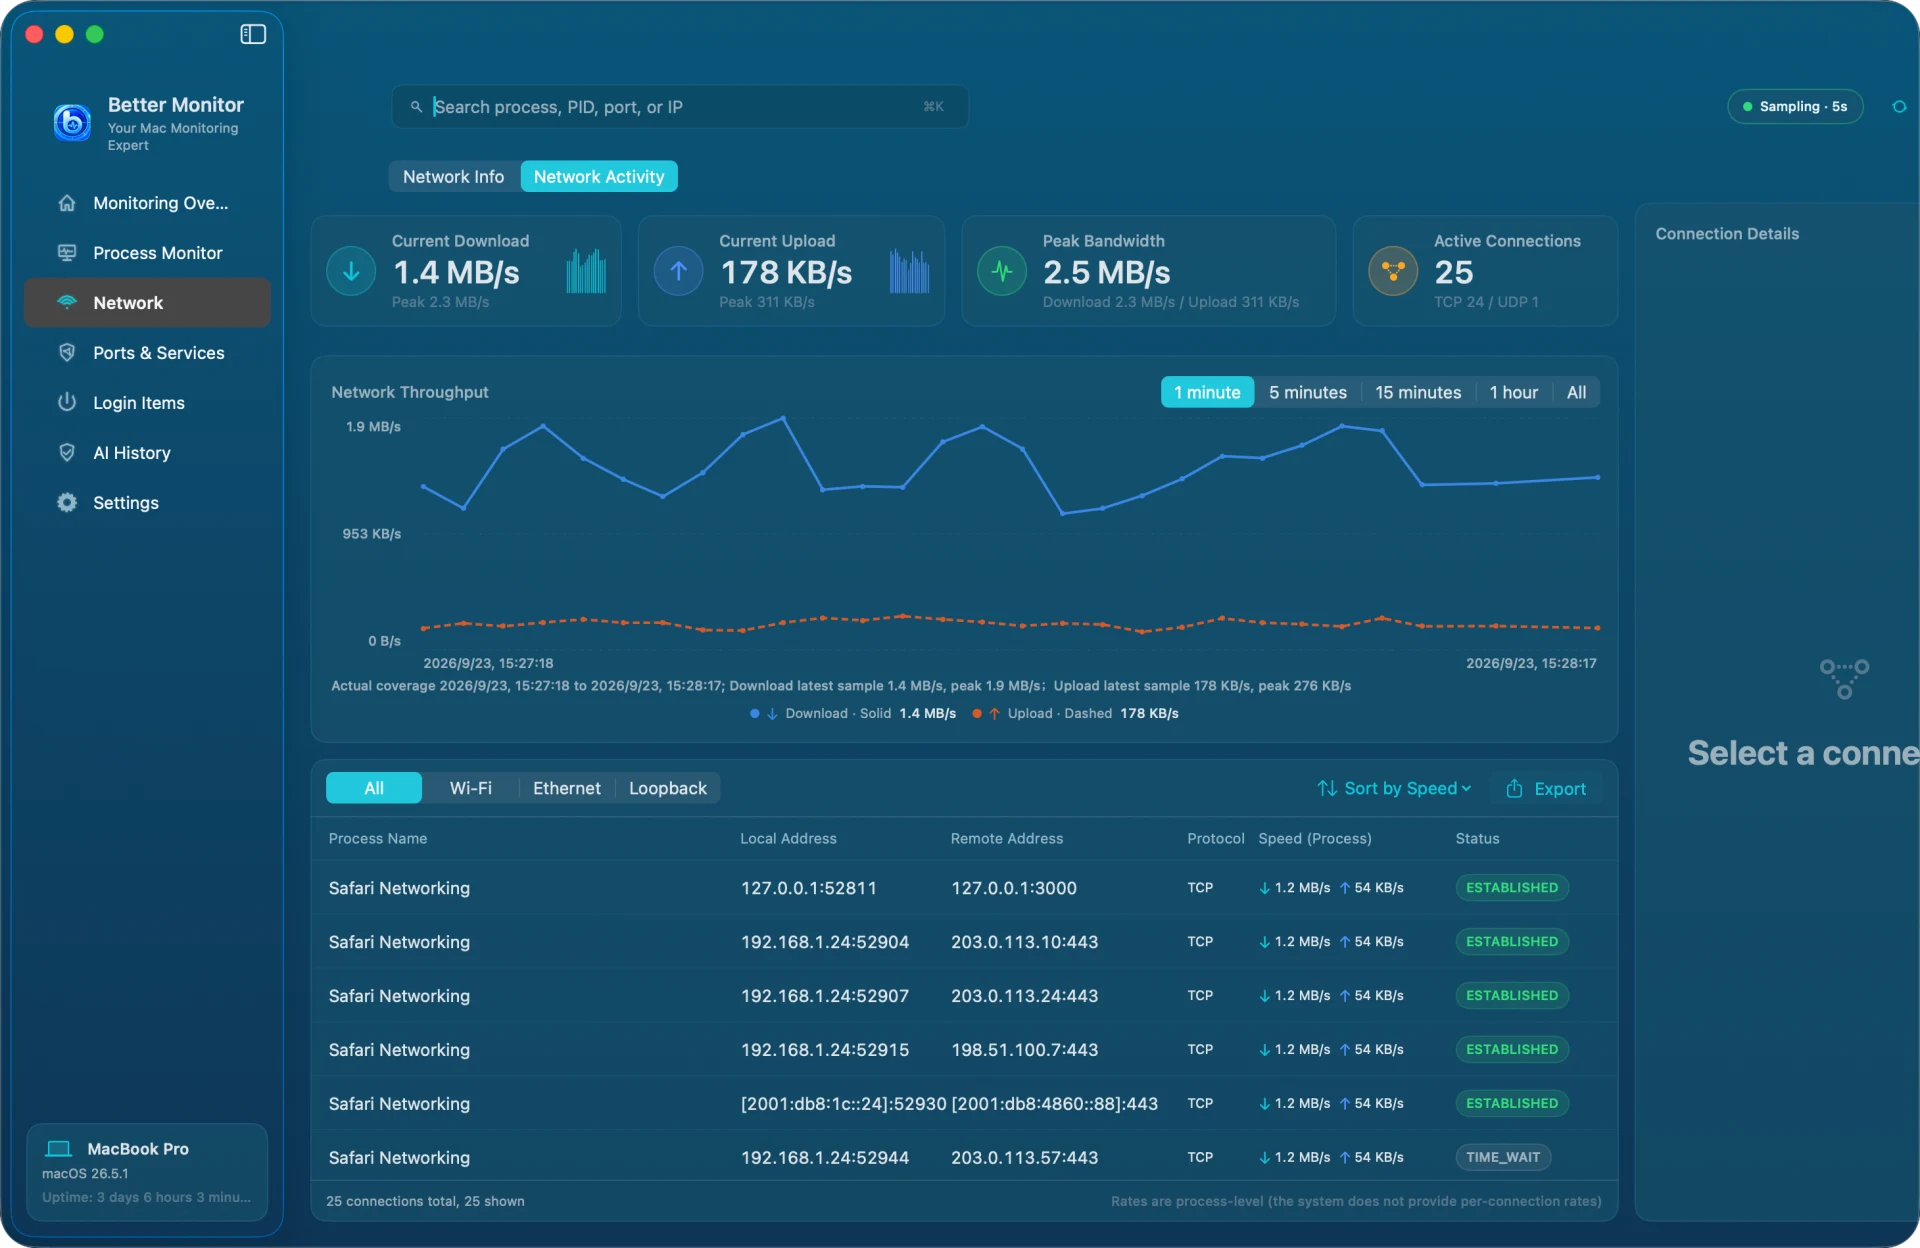
Network Activity
The top row shows current download, current upload, peak bandwidth, and active connections. The throughput chart switches between 1 minute, 5 minutes, 15 minutes, 1 hour, and All; the 1-hour and All ranges come from local history and keep only the combined rate.
- Filter connections by All, Wi-Fi, Ethernet, or Loopback
- Each connection shows its process, local address, remote address, protocol, speed, and TCP state
- Sort by speed or export the list
- Select a connection to see everything in Connection Details
About the speed column
macOS does not report per-connection speeds, so the speed shown is the overall rate of the process that owns the connection. Several connections from one process show the same value.