

Find the processes using CPU and memory on your Mac
When the fans spin up, the battery drains fast, or an app hangs, Process Monitor helps you find out why.
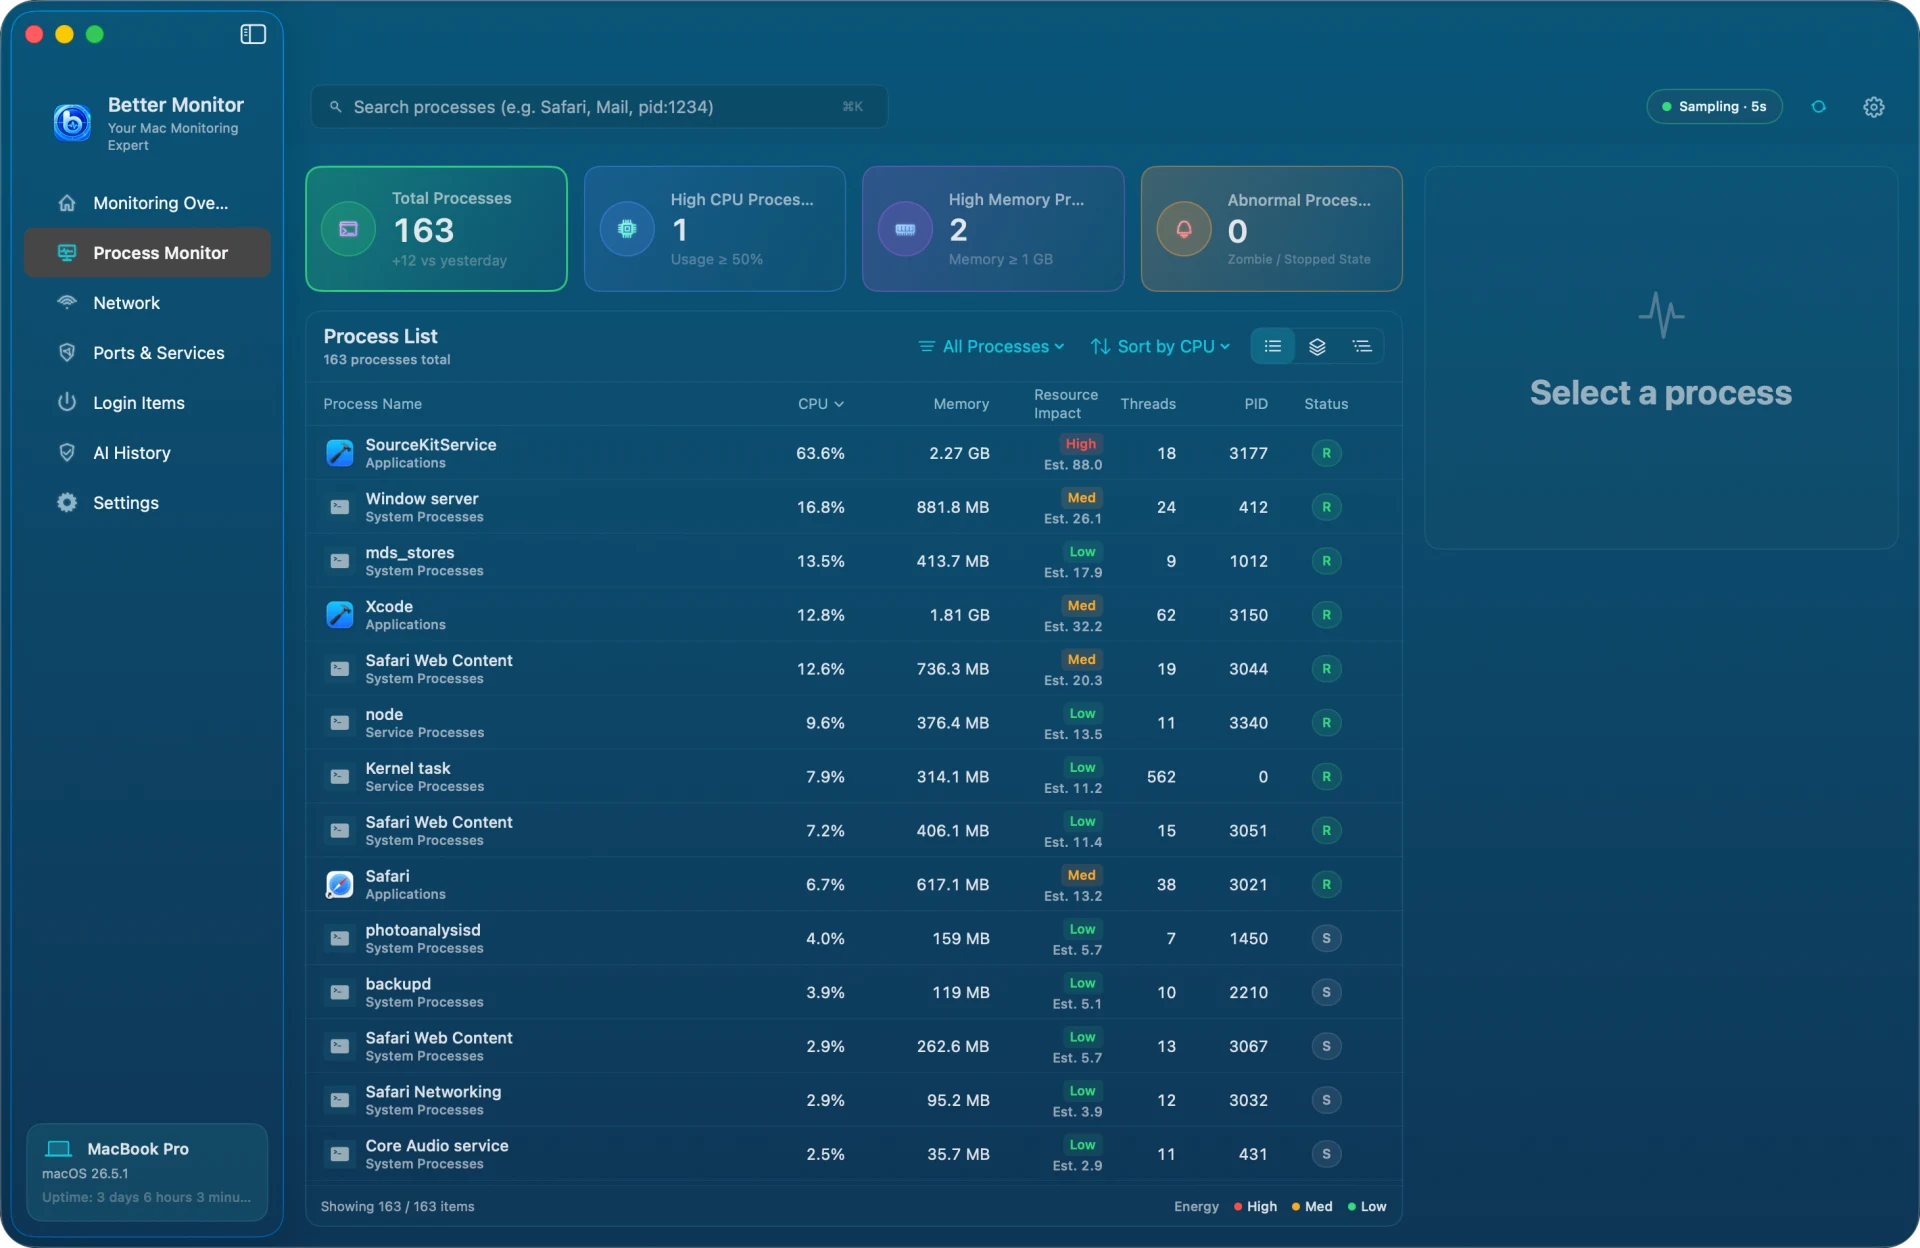
Start with the four cards
The top row shows Total Processes (with the change since yesterday), High CPU Processes (≥ 50%), High Memory Processes (≥ 1 GB), and Abnormal Processes (zombie or stopped). Click a card to show only those processes; click it again to clear the filter.
Sort, filter, and switch views
The list sorts by CPU by default and can also sort by memory, resource impact, threads, or PID. Resource Impact is a local estimate from current CPU and resident memory, rated high, medium, or low.
- All Processes: every process on its own row
- Aggregated View: the processes of one app grouped together
- Process Tree: parent–child relationships, so you can see what launched what
Open Process Details
Double-click a process or choose View Details to see its name, version, developer, code signature, executable path, parent process, user, and start time, plus charts for CPU, memory, threads, and disk reads and writes. Open Files lists the files and folders the process has open. From the bottom bar you can export or copy a report, or view it in Activity Monitor.
Quit a process or watch it
Quit process asks for confirmation and warns that unsaved data may be lost. Right before sending the signal, Better Monitor re-checks the process identity and refuses if the PID now belongs to a different process. System processes and processes owned by other users usually cannot be quit. Add to Watch remembers a process by its executable path, so it stays tracked after a restart changes its PID.